Local produce is an important component of nutrition incentive programs and knowledge of retail pricing, or the art and science of determining what price to sell an item for, can be helpful for grantees in understanding the relationship between grocers and local producers. Below is a basic “grocery 101” primer on how retail pricing works.
Calculating Gross Margin Percentage
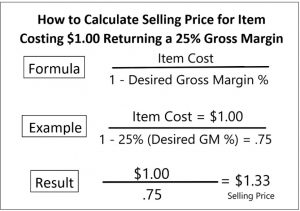
The formula and example at right is generally known as a gross margin percentage calculation and is used by stores to determine a selling price.
For the $1.33 selling price calculated in the formula, this means after the retailer pays the $1 cost of the product, there is ≈33¢ remaining as gross profit dollars or in this example, cents. All operating expenses, such as labor, benefits, rent, electric and many other expenses, must be paid for out of the 33¢ cents hopefully leaving pennies for an operating profit.
There is a difference between gross margin percentage vs. markup on cost. If you have an item that you paid $1 for and you “mark it up” 25% ($1 x 1.25) and sell it for $1.25 you are only returning a 20% gross margin on the $1 cost. If your operating costs, referenced previously, are more than 20% you will surely go out of business. In general, conversations within the grocery business are focused on gross margin percentages and gross profit dollars, not markup.
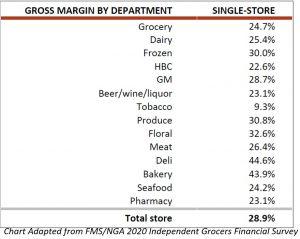
A 2020 survey found that in produce departments across the country, the average gross margin percentage is 30.8%. Using the gross margin percentage formula, we can see if the store pays a supplier $1.00 for an item, it will need to be sold to customers for ≈$1.45 ($1/.692).
Why Different Gross Margin Percentages and Retail Prices? As the chart illustrates, depending on the department, there can be different gross margin percentages associated with item prices. So, for produce and meat, you may have the same cost on an item, but because of differing department expense structures, you have two different retail prices. Differing retail price structures within a store may be illustrated in terms of a can of soup vs. a stalk of celery.
In summary, celery had additional ongoing “costs” for labor, packaging materials, storage/preservation and even a potential total loss of not being sold and being tossed into trash. Meanwhile, the can of soup sat on the shelf waiting to be sold without any additional costs other than inventory carrying costs.
As all GusNIP grantees consider program design and requirements for local produce in grocery stores, hopefully understanding the terminology and basic math components of the retail food industry will lead to successful nutrition incentive implementations.
Have questions or want to know more about the grocery business? Please contact us at incentives@nationalgrocers.org or visit https://www.ngaftacenter.org/
*The NGAF TA Center addresses the challenges grocers and supermarket operators face in establishing nutrition incentive programs and is a proud partner of the Nutrition Incentive Hub. The Nutrition Incentive Hub, funded through a cooperative agreement from the United States Department of Agriculture, National Institute of Food and Agriculture, is a new resource that provides training, technical assistance, reporting, and evaluation for those working to launch or expand SNAP incentives or produce prescription programs. The Nutrition Incentive Hub is led by Gretchen Swanson Center for Nutrition in partnership with Fair Food Network along with a coalition of evaluators, researchers, practitioners, and grocery and farmers market experts from across the country dedicated to strengthening and uniting the best thinking in the field to increase access to affordable, healthy food to those who need it most.